We help e-commerce brands spending $1m–$20m a year on paid media find where their advertising budget is actually incremental.
Move $1m of your existing ad budget.
Grow revenue without spending a dollar more.
You spend $5m a year on paid media. Meta's dashboard claims it drove $12m in revenue, Google claims $10m, TikTok claims another $4m — and your books show $15m in total. Each platform is counting the same orders, so no channel's ROAS can be trusted for a budget decision. We rebuild one revenue line, show which channel is saturated and which is starved, and prove the move with a geo-holdout before you commit.
- No new spend
- Same budget, reallocated
- We move existing money between channels, not ask for more
- Two stages
- Model, then experiment
- An MMM hypothesis, verified by a geo-holdout
- Two documents
- Decision deck + technical report
- 5-10 pages for the board, the full method for your analyst
01
The reporting gap
Five dashboards, five versions of the truth, one set of books.
Every platform reports your spend honestly and your revenue generously. Each counts any conversion it touched inside its own attribution window, and none of them subtract the sales you would have made without advertising at all. The result: a stack of ROAS numbers that cannot be compared, cannot be summed, and are the basis for most budget decisions made in e-commerce today.
1 — What you spend
2 — What each dashboard claims it caused
3 — What actually happened
Revenue on your books
$8.40M
Of which media actually caused
$6.52M
The rest is baseline demand, seasonality and price — it would have arrived with no ads at all.
The platforms claim 1.3x your booked revenue, because the same order is sold back to you by every channel that touched it.
4 — What we do with it: move the money, not add to it
Channels on the flat part of their response curve are saturated — the next dollar there buys almost nothing. Channels still on the rise have headroom. Total spend is unchanged: $2.40M before, $2.40M after.
Blended ROAS on the same budget
2.87x3.43x
+19.5% revenue from the same $2.40M of media — then verified with a geo-holdout before you commit the budget.
Simulated dataset — illustrative, not client data
The same picture, channel by channel
Switch between what your dashboards report and what the model attributes, against the one revenue line on your books.
| Source | Spend | Revenue credited | ROAS | Share of the $8.4M booked |
|---|---|---|---|---|
| Meta Ads Manager | $0.96M | $4.03M | 4.20x | |
| Google Ads | $0.72M | $4.32M | 6.00x | |
| TikTok Ads | $0.36M | $1.08M | 3.00x | |
| Klaviyo / email | $0.12M | $0.90M | 7.50x | |
| Affiliate & other | $0.24M | $0.56M | 2.33x | |
| Sum of the dashboards | $2.40M | $10.89M | 4.54x | |
| Revenue on the books | $8.40M |
The platforms credit themselves with $10.89M against $8.40M of actual revenue — including revenue that would have arrived with no ads at all. Every ROAS in that column is a different number for the same customer, counted more than once.
Simulated dataset — illustrative, not client data
02
How we do it
Five steps, no Greek letters.
The depth is there so you can audit it, not so you have to read it. Here is what happens, in plain language, before we open the mathematics.
01
Reconstruct your actual revenue
Pull every platform's claimed revenue and line it up with the one revenue line on your books.
You get: You see exactly how much attribution is double-counted, and where the gap is largest.
02
Estimate incremental contribution by channel
Build a model that separates baseline demand, seasonality, promotions and true ad-driven lift.
You get: A ROAS per channel that actually sums to your revenue, with response curves and confidence intervals.
03
Find the optimal allocation
Solve for the split that makes the next dollar of ad spend equally profitable everywhere.
You get: A specific budget move — how much to move from which channel to which — with revenue and profit attached.
04
Test the recommendation
Design a geo-holdout / synthetic control experiment to prove the model's biggest claim.
You get: A causal estimate of incrementality, not just a forecast that looked good on paper.
05
Give you the evidence and the model
Deliver a board-ready decision deck and a full technical report with code and data.
You get: You can make the change, and your team — or any analyst you hire later — can check the work.
03
What we actually solve
It's a constraint problem: fixed budget, best possible split.
You have already decided how much to spend on advertising. The only question is where each dollar does the most work. At the optimum, the next dollar of incremental profit is the same in every funded channel. That is the condition the model solves.
Fig. — what the work looks like underneath
> head(raw_data) # weekly panel, one row per week
| DATE | revenue | tv_S | search_S | social_S | ooh_S | competitor |
|---|---|---|---|---|---|---|
| 2022-01-03 | 359,491 | 0 | 0 | 4,823 | 0 | 235,617 |
| 2022-01-10 | 446,646 | 14,422 | 9,255 | 4,972 | 0 | 250,057 |
| 2022-01-17 | 464,433 | 18,772 | 4,334 | 3,190 | 0 | 236,372 |
| 2022-01-24 | 459,347 | 12,105 | 6,921 | 5,410 | 12,900 | 241,884 |
| 2022-01-31 | 492,018 | 9,340 | 11,208 | 6,077 | 12,900 | 247,331 |
# 156 weeks · spend per channel · price, promo, competitor and seasonality controls
Simulated dataset — illustrative, not client data. Built on open-source tooling (R, Robyn, glmnet, Prophet, Python) so nothing is a black box you can't audit.
04
Two stages
A model is a hypothesis. An experiment is proof.
Stage one
The hypothesis
Marketing mix model
Three years of weekly data, one revenue line. Adstock and saturation estimated per channel, ridge regression to handle the fact that all your budgets move together, and a multi-objective hyperparameter search rather than a single fit statistic. Output: contribution and marginal ROI per channel, and a reallocation that respects ±50% guard rails.
- Revenue decomposed into baseline, seasonality, price and each channel
- Response curves showing which channels are starved and which are flat
- A specific budget move with revenue and profit attached
Stage two
The proof
Geo-holdout / synthetic control
We turn spend down in selected regions and build a synthetic control — a weighted blend of untreated regions that tracked the treated ones closely beforehand. The divergence after switch-off is the causal incremental effect, with a confidence interval. That result then calibrates the model, so stage one stops being a correlation story.
- Pre-treatment fit and placebo tests reported, not hidden
- Incrementality with an interval, not a point estimate
- The lift result feeds back as a calibration objective in the model
Most vendors stop at stage one, because stage one always produces a confident-looking chart. The holdout is what separates a model that fits your history from a model that predicts what happens when you change the budget.
05
Pricing
Nobody should wire five figures to a stranger before seeing how they think.
The $1,500 Reality Check is the cheap way to see the work. If you continue, that fee comes off the next step. No retainers, no hourly surprises, and the scope is written down before anything starts.
$1,500
Attribution Reality Check
7 days, fixed scope.
A focused reconciliation: where your dashboards over-claim, how much revenue is double-counted, and whether the case for a full model is strong enough. Fully creditable toward the $9,500 package.
Start here$9,500
Marketing Mix & Budget Optimisation
4 weeks.
Full marketing mix model, optimal budget reallocation, and a 5-10 page decision deck plus technical report. The $1,500 Reality Check fee is credited in full.
Book the full model$15,000
Optimisation + Incrementality Validation
4 weeks.
Everything in the $9,500 package, plus a geo-holdout / synthetic control experiment designed and analysed to validate the model's biggest recommendation.
Add the experiment$2,500/mo
Measurement Partner
Monthly retainer.
Monthly model updates, performance monitoring, and ongoing budget recommendations. For teams that want to re-run the analysis every period without rebuilding the engagement each time.
Ask about monthly06
See it on your own numbers
No new spend — same budget, different split.
Put in your revenue, your ad spend and your margin, then set the current split across channels. The calculator fits a saturation curve to each channel and solves the same equal-marginal-return condition an engagement solves — capped at ±50% per channel. It is a demonstration of the logic, not a substitute for the model.
Breakeven ROAS
1.82x
1 ÷ gross margin. Below this, a dollar of media loses money.
Where the budget goes today
Same budget, reallocated
Blended ROAS moves from 2.65x to 2.75x without spending another dollar — $247,843 of extra revenue and $136,314 of extra gross profit a year.
| Channel | Now | Recommended | Change | ROAS now | ROAS after |
|---|---|---|---|---|---|
| Meta | $960K | $862.6K | -10% | 2.60x | 2.78x |
| $720K | $1.1M | +50% | 3.60x | 2.92x | |
| TikTok | $360K | $277.4K | -23% | 1.90x | 2.18x |
| Other | $360K | $180K | -50% | 1.60x | 2.47x |
| Total | $2.4M | $2.4M | 0% | 2.65x | 2.75x |
Fig. 2 — response curves, current vs recommended
Your dashboards would add up to $10,296,000 of ad-driven revenue today. The model attributes $6,348,000 — a gap of $3,948,000 of double-counted credit. Budget decisions made on the first number are made on a number that does not exist.
Illustrative projection from your own inputs and default response curves — not a guarantee. Real figures come from curves estimated on your data and verified with a geo holdout.
07
What lands on your desk
Figures your board reads, appendices your analyst checks.
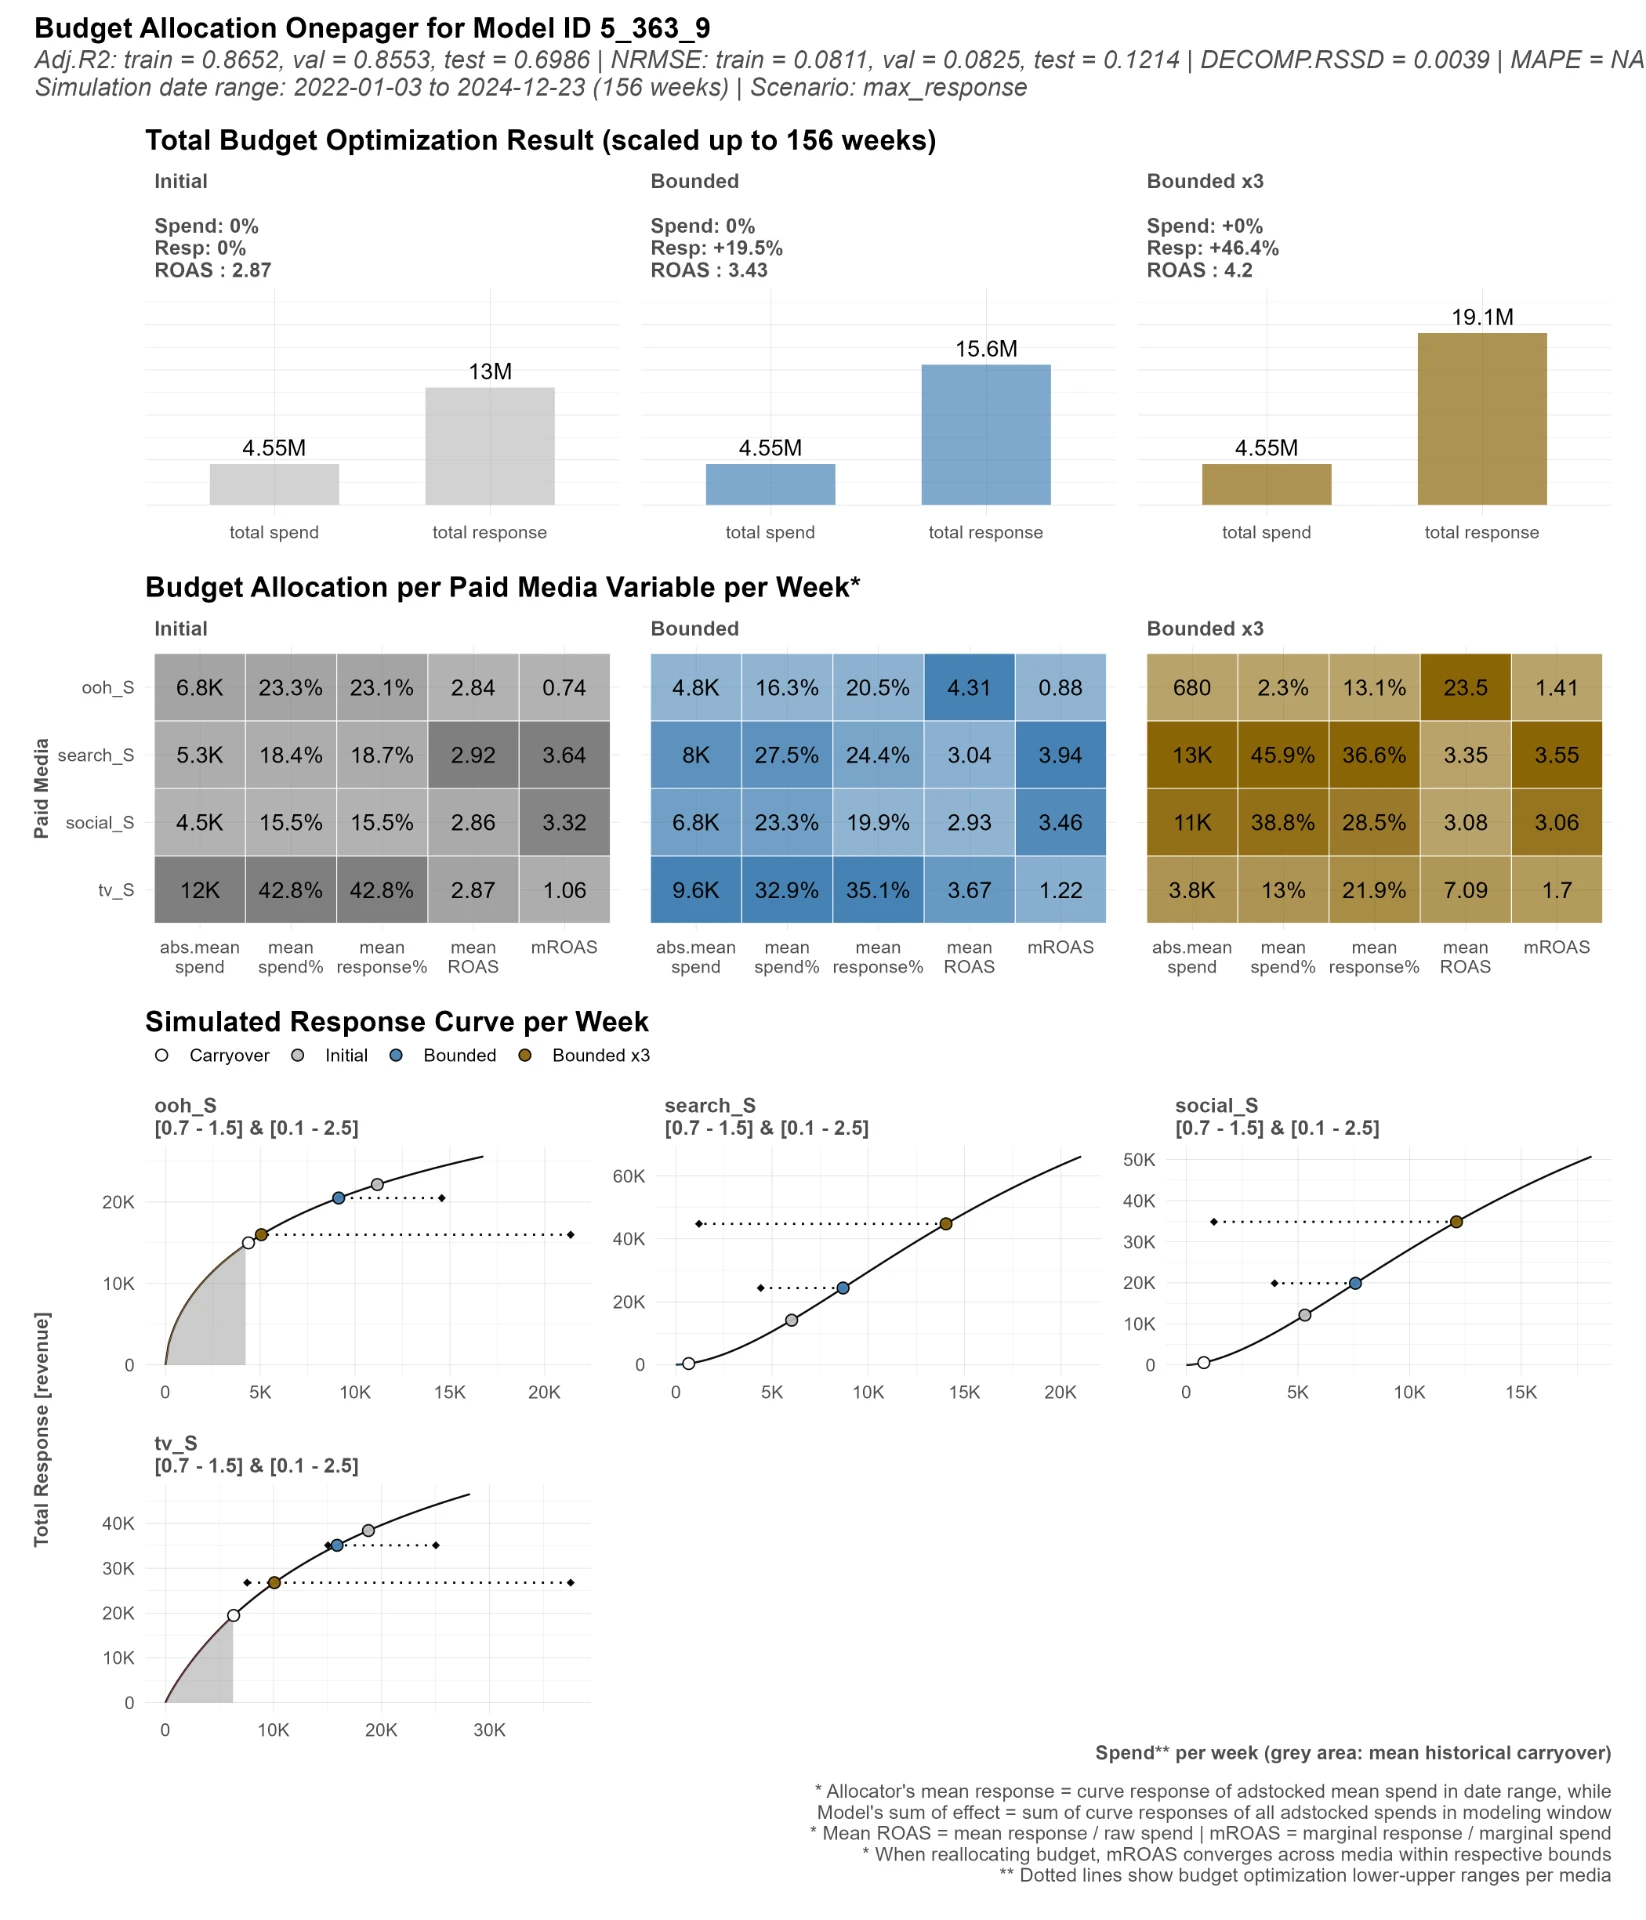
Fig. A — budget reallocation
The decision page
Current versus recommended spend per channel under bounded and aggressive scenarios, the response curve each recommendation sits on, and the expected revenue attached to the move.
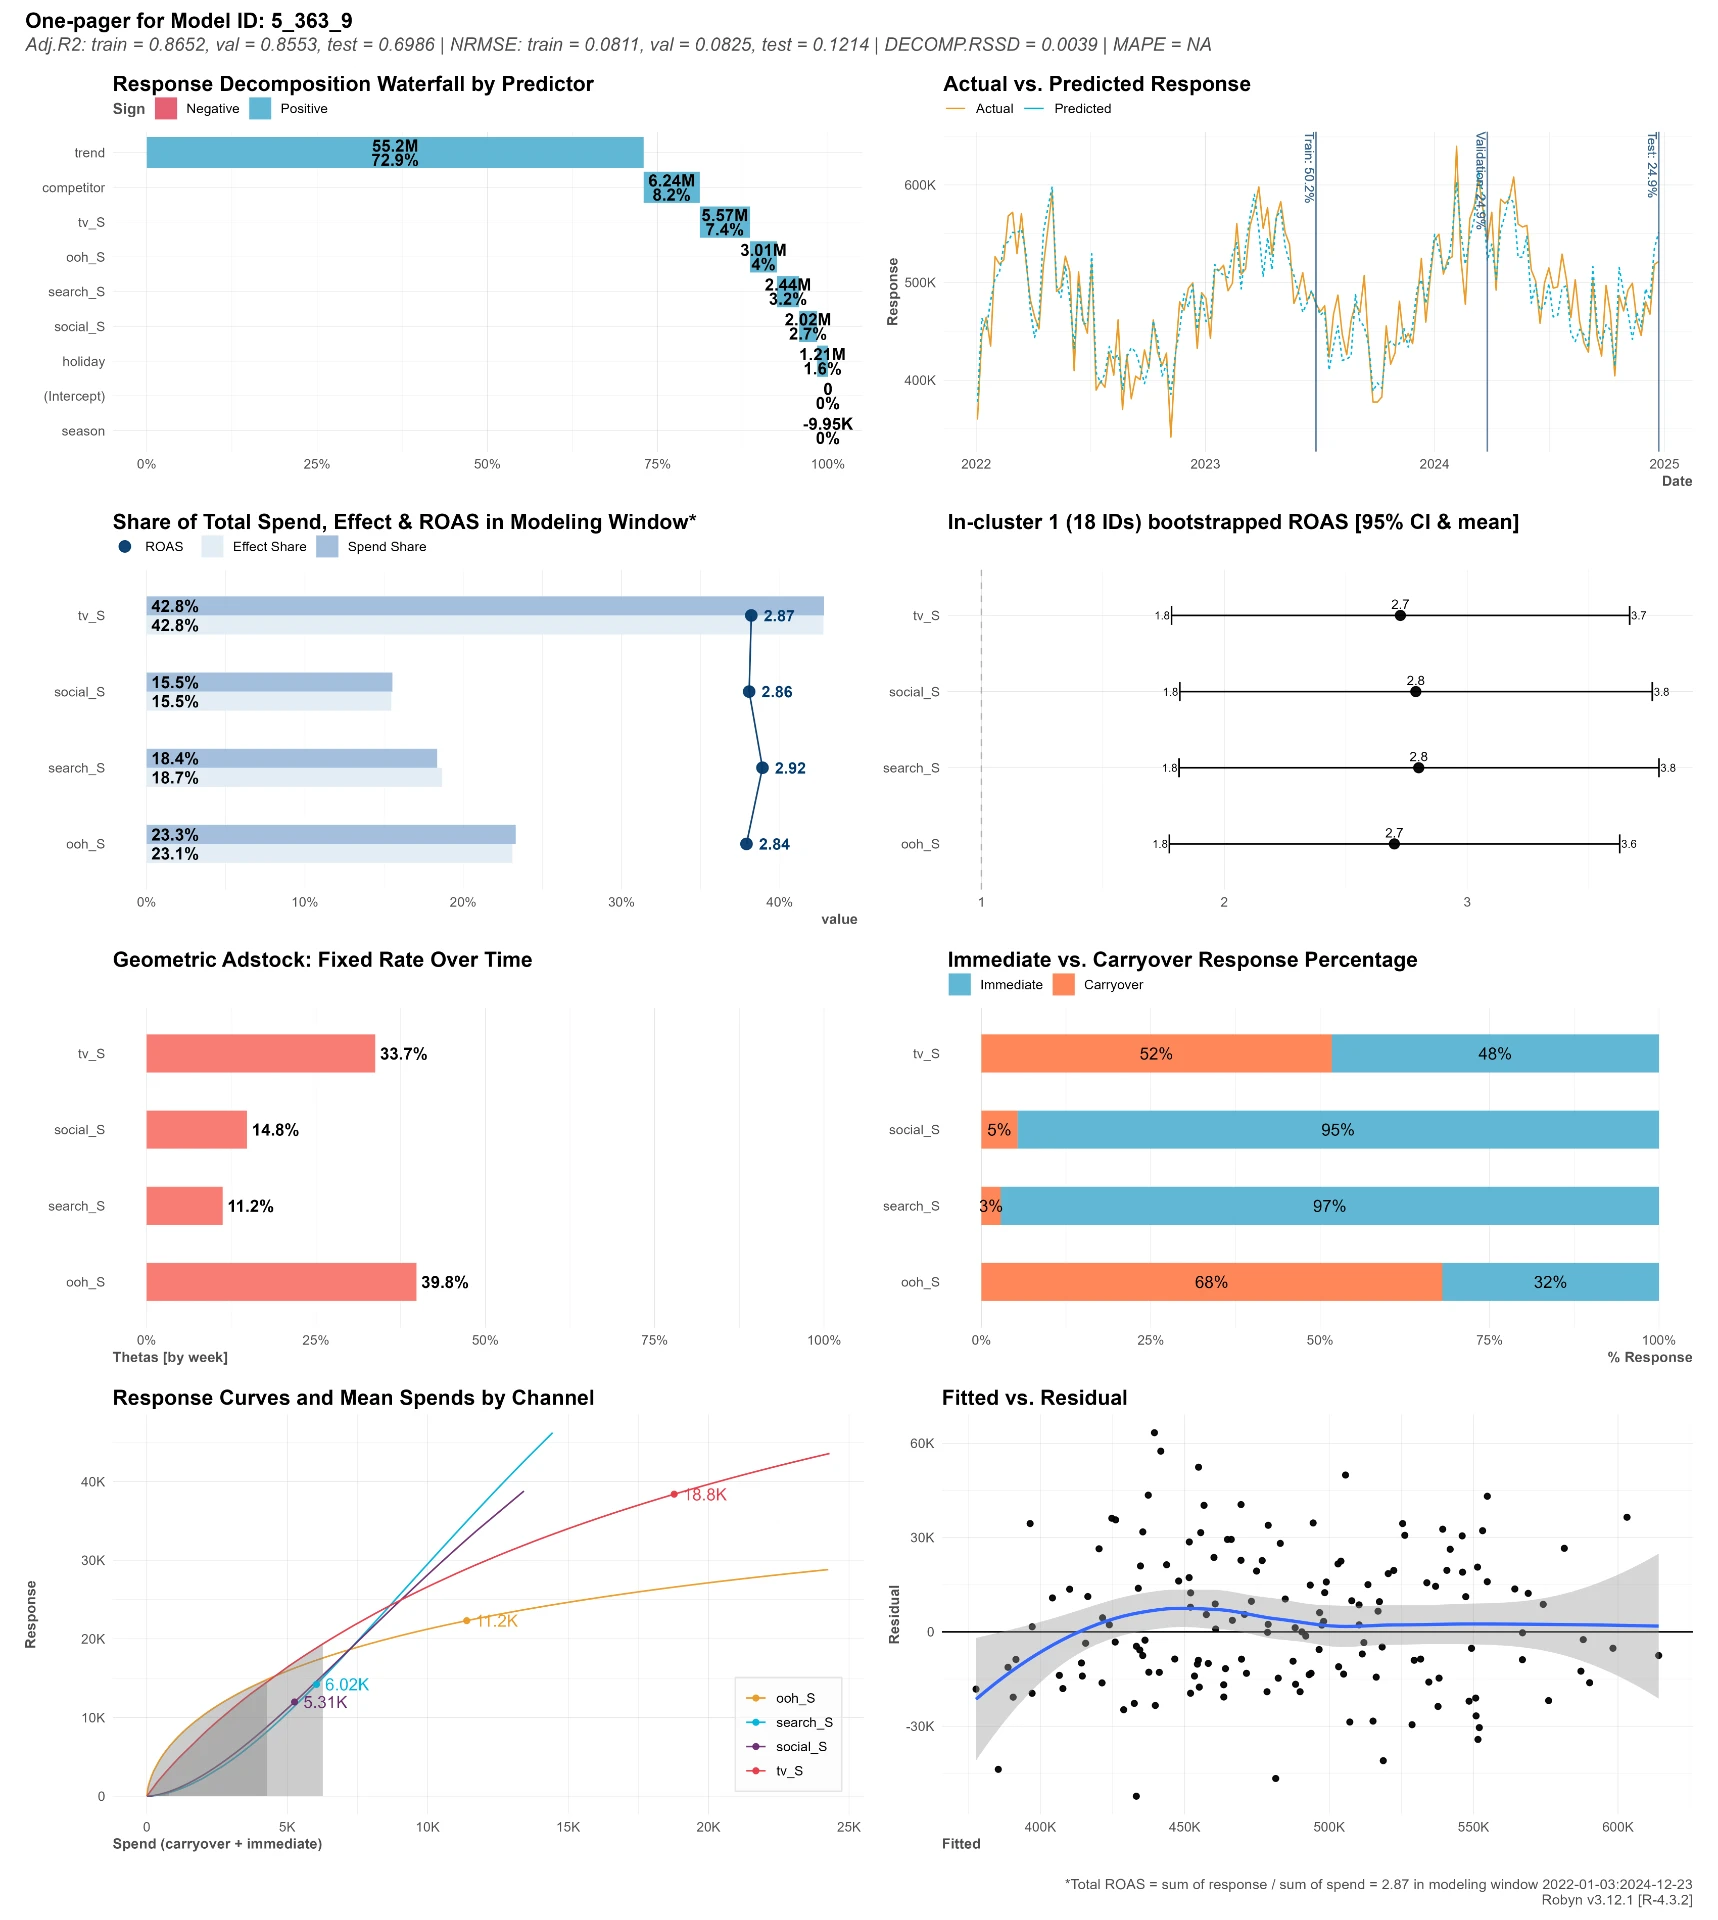
Fig. B — model diagnostics
The evidence page
Response decomposition, actual versus predicted fit, bootstrapped ROAS intervals, estimated adstock decay per channel and residual diagnostics — so the model can be interrogated, not just admired.
5-10 pages
Decision deck
The moves, the money and the risk — written for people who do not want to hear the word heteroskedasticity.
Full method
Technical report
Model specification, hyperparameter search, diagnostics, holdout design and every assumption, in Quarto / R Markdown.
Reproducible
Working files
Cleaned data, code and model objects, so the analysis can be rerun next quarter by you or by us.
08
How it runs
Four weeks, about two hours of your time.
- Week 1ReconcilePull spend and revenue from every platform and your store, line them up against the books, and quantify exactly how much credit is double-counted.
- Week 2ModelFit adstock and saturation per channel, ridge regression, multi-objective hyperparameter search, and inspect the Pareto-front models by hand.
- Week 3OptimiseSolve the constrained allocation, build bounded and aggressive scenarios, and design the geo-holdout that will test the biggest claim.
- Week 4DecideReadout: the recommended moves, expected revenue and profit, confidence, and the test that verifies it. Both documents delivered.
What we need from you
Store
Shopify, WooCommerce, BigCommerce, Magento, Amazon Seller Central or your ERP
Weekly revenue, orders, AOV, margin, promotions, stockouts
Media
Meta, Google, TikTok, Pinterest, Snap, Amazon Ads, offline / OOH / TV
Weekly spend and impressions per channel — CSV export is fine
Context
GA4, price changes, competitor activity, launches
Anything that moved revenue for a reason other than advertising
No dashboard access required, no tracking script to install, no pixel changes. CSV exports and read-only access are enough.
09
In the pipeline
Under construction. Ask if you want to be first.
These are not available as standard engagements yet. They are listed because clients ask about them, and they shape what we build next.
Waitlist
A/B and experiment testing programme
A structured experiment service built on the same discipline as the geo-holdout. Each test isolates one variable, one goal metric and a written hypothesis, with a random even split run to statistical significance before any winner is called.
- Experiment Design — $750. Client provides hypothesis, historical conversion/revenue data, traffic estimate and proposed intervention. You receive sample-size calculation, power analysis, randomisation/treatment structure, primary/secondary metrics, analysis methodology and a pre-analysis plan.
- Experiment Analysis — $750–1,500. After the client returns results, we run the treatment-effect estimate, confidence interval, significance/power, heterogeneous effects, robustness checks and an executive interpretation.
- Typical applications: email subject lines, preview text and sender name; paid-ad creative, copy angle and audience segment; landing-page layout, headline and form length.
Waitlist
Hierarchical Bayesian MMM for multi-location retail
Google Meridian-based modelling for physical store networks rather than e-commerce. Partial pooling across locations lets small stores borrow strength from the network, with priors and uncertainty carried through to the budget recommendation.
- Built for retail chains with many locations, not digital-first DTC brands.
- Shares information across stores so sparse regions still get reliable estimates.
- Uncertainty is propagated into the budget recommendation, not buried in a single point estimate.
10
Questions
The things CEOs ask first.
11
Start here
Send your numbers.
Tell us your revenue, your ad spend and what you suspect is wrong with your reporting. You get a written reply with an initial read on where the double-counting probably sits and whether a model plus holdout is worth your money — before anyone asks you for a contract.
- Reply within two business days
- Scope, price and timeline in writing before work starts
- Fixed-fee engagements, no retainer required
- Everything under NDA on request
Principal analyst
Statistician and econometrician working in R, Python and Robyn. Reports are written in Quarto, R Markdown or Overleaf and delivered as both a decision deck and a technical appendix.